| Morningstar® Fund Report™|05/04/2026 |
|
| Performance History | 31/03/2026 |
| Growth of 1,000(USD) | |
|
|
|
| • | Fund | -14.85 | 15.70 | 16.71 | 12.63 | -0.17 |
| • | +/-Cat | -2.98 | 2.01 | 8.26 | -8.38 | 0.62 |
| • | +/-Idx | -9.71 | 4.68 | 5.34 | -11.13 | -3.46 |
| Category: Global Equity Income | ||||||
| Index: Morningstar Global Markets High Dividend Yield NR USD | ||||||
| Trailing Returns | 02/04/2026 | |||||
| Fund | +/-Idx | |||||
| YTD | 0.71 | -3.77 | ||||
| 3 Years | 45.81 | -11.03 | ||||
| 5 Years | 44.21 | -20.60 | ||||
| 10 Years | 114.62 | -45.03 | ||||
| 12 Month Yield | - | |||||
| Dividend Paying Frequency | Monthly | |||||
| Key Stats | ||
Morningstar Category
Global Equity Income
Morningstar Rating™

ISIN
LU1116320737
NAV 02/04/2026
USD 9.1500
Day Change
-0.33%
Total Net Assets (mil)
31/03/2026
USD 11916.69
USD 11916.69
Front Load Fee(Max)
3.00%
Deferred Load Fee
-
Manager Name
Muzo Kayacan
Andrew Huzzey
Robert Fisher
Inception Date
08/10/2014
| Benchmark | ||||
| ||||
| Investment strategy |
| The Fund seeks to generate a high level of income. The Fund invests globally, with no prescribed country or regional limits, at least 70% of its total assets in equity securities. In order to achieve its investment objective and policy, the Fund will invest in a variety of investment strategies and instruments. In particular, the Fund will use quantitative (i.e. mathematical or statistical) models in order to achieve a systematic (i.e. rule based) approach to stock selection. This means that stocks will be selected based on their expected contribution to portfolio returns when risk and transaction cost forecasts are taken into account. |
| Portfolio Profile | 28/02/2026 |
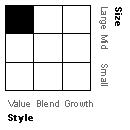
| Morningstar Style Box®_Morningstar: | |||||
| Equity Style | |||||
|
|||||
| Asset Allocation % | |||
| % Long | % Short | % Net Assets | |
| Stocks | 93.46 | 11.49 | 81.97 |
| Bonds | 0.00 | 0.00 | 0.00 |
| Cash | 47.74 | 29.71 | 18.03 |
| Other | 0.00 | 0.00 | 0.00 |
|
|
|||||||||||||||||||

| Top 5 Holdings | Sector | % |
|
|
 Communication Services
|
3.47 |
|
|
 Technology
|
3.28 |
|
|
Technology
|
2.51 |
|
|
Communication Services
|
2.07 |
|
|
 Utilities
|
2.06 |
|
| ||
| For the market value of financial derivatives, Morningstar's calculation method includes the nominal value of derivative agreements to reflect position-holding (position) for your reference. If the position-holding ranking calculated by Morningstar shall be different from that published by the fund company, the ranking in the monthly report (click here) by the fund company shall prevail. | ||
| Annual Returns | 31/03/2026 | |||||||
| 2019 | 2020 | 2021 | 2022 | 2023 | 2024 | 2025 | 2026 | |
| Total Return | 17.27 | 8.86 | 17.01 | -14.85 | 15.70 | 16.71 | 12.63 | -0.17 |
| +/- Category | -4.35 | 3.73 | -0.17 | -2.98 | 2.01 | 8.26 | -8.38 | 0.62 |
| +/- Index | -3.43 | 8.38 | -2.24 | -9.71 | 4.68 | 5.34 | -11.13 | -3.46 |
| % Rank (Rel to Cat) | 88 | 30 | 55 | 72 | 33 | 9 | 91 | 57 |
| Trailing Returns | 02/04/2026 | |||
| Total Return | +/- Category | +/- Index | ||
| 1 Day | -0.33 | -0.33 | -0.44 | |
| 1 Week | 0.48 | -2.09 | -1.38 | |
| 1 Month | -3.21 | 0.14 | -0.66 | |
| 3 Months | 0.61 | 2.19 | -3.01 | |
| 6 Months | 2.15 | 2.30 | -5.96 | |
| YTD | 0.71 | 2.43 | -3.77 | |
| 1 Year | 12.15 | 1.28 | -14.84 | |
| 3 Years | 45.81 | -3.65 | -11.03 | |
| 5 Years | 44.21 | -8.96 | -20.60 | |
| 10 Years | 114.62 | -28.84 | -45.03 | |
| Category:Global Equity Income | ||||
| Index:Morningstar Global Markets High Dividend Yield NR USD | ||||
| Quarterly Returns | 31/03/2026 | |||
| Quarter 1 | Quarter 2 | Quarter 3 | Quarter 4 | |
| 2026 | -0.17 | - | - | - |
| 2025 | 0.34 | 7.13 | 3.19 | 1.54 |
| 2024 | 7.35 | 3.72 | 5.03 | -0.20 |
| 2023 | 5.05 | 4.03 | -2.22 | 8.27 |
| Dividend | 02/04/2026 |
| 12 Month Yield | - |
| 2026 | 0.19 |
| 2025 | 0.68 |
| 2024 | 0.63 |
| 2023 | 0.65 |
| Morningstar Rating™ | 28/02/2026 |
| 3-Year |
|
| 5-Year |
|
| 10-Year |
|
| Overall |
|
| Volatility Measurements | 31/03/2026 | |||||||||||||||||||||||||
|
||||||||||||||||||||||||||
| Investment Style Details | 28/02/2026 | |||||||||||||||||||||||||||||||||||||||
|
|
|||||||||||||||||||||||||||||||||||||||
|
||||||||||||||||||||||||||||||||||||||||
| Category: Global Equity Income | ||||||||||||||||||||||||||||||||||||||||
| AssetAllocation | 28/02/2026 |
|
|
|
|||||||||||||||||||||
| World Regions | 28/02/2026 | |||||||||||||||||||||||||||||||||||||||||||||||||||
|
||||||||||||||||||||||||||||||||||||||||||||||||||||
| Category: Global Equity Income | ||||||||||||||||||||||||||||||||||||||||||||||||||||
| Stock Sector Weightings | 28/02/2026 | ||||||||||||||||||||||||||||||||||||||||||||||||||||||
|
|||||||||||||||||||||||||||||||||||||||||||||||||||||||
| Category: Global Equity Income | |||||||||||||||||||||||||||||||||||||||||||||||||||||||
 Cyclical
 Basic Materials
 Consumer Cyclical
 Real Estate
 Sensitive
 Energy
 Defensive
| Top 10 Holdings | 28/02/2026 |
| Portfolio | |
| Total Number of Equity Holdings | 273 |
| Total Number of Bond Holdings | 0 |
| Assets in Top 10 Holdings % | 22.91 |
| Product Name | Sector | Country/Region | % of Assets | ||
|
|
Communication Services
|
United States | 3.47 | ||
|
|
Technology
|
United States | 3.28 | ||
|
|
Technology
|
United States | 2.51 | ||
|
|
Communication Services
|
United States | 2.07 | ||
|
|
Utilities
|
France | 2.06 | ||
|
|
 Financial Services
|
United States | 2.01 | ||
|
|
 Consumer Defensive
|
United States | 1.99 | ||
|
|
Technology
|
United States | 1.93 | ||
|
|
 Healthcare
|
United States | 1.81 | ||
|
|
Consumer Defensive
|
United States | 1.79 | ||
|
|
|||||
| Category: Global Equity Income | |||||
| For the market value of financial derivatives, Morningstar's calculation method includes the nominal value of derivative agreements to reflect position-holding (position) for your reference. If the position-holding ranking calculated by Morningstar shall be different from that published by the fund company, the ranking in the monthly report (click here) by the fund company shall prevail. | |||||
| Management Team | |||||||||||||||||||||||||||||
|
|||||||||||||||||||||||||||||
|
|||||||||||||||||||||||||||||
| Biography | |||||||||||||||||||||||||||||
| Muzo Kayacan, CFA, Vice President and Portfolio Manager, is a member of the Europe Equities team in the Scientific Active Equity division of BlackRock's Portfolio Management Group. He is responsible for managing the European Alpha Advantage and Long-only Funds. Prior to joining Blackrock in 2010, Mr. Kayacan was a Senior Associate Portfolio Manager at AllianceBernstein, where he was responsible for implementing investment decisions in Global Developed and Emerging Markets institutional equity portfolios, as well implementing active and passive currency hedging strategies. From 2005-2007 he completed a graduate training scheme with M&G, followed by a role in the product development team. Before joining M&G he was a futures trader. Mr Kayacan earned a bachelors degree in Psychology from Warwick University in 2003. He is a CFA charterholder. | |||||||||||||||||||||||||||||
|
|||||||||||||||||||||||||||||
| Biography | |||||||||||||||||||||||||||||
|
|||||||||||||||||||||||||||||
| Biography | |||||||||||||||||||||||||||||
| Robert Fisher, CFA, Director and senior portfolio manager, is a member of the European Equities team in the Scientific Active Equity division of BlackRock's Portfolio Management Group. He is responsible for managing Market Neutral strategies. Mr. Fisher's service with the firm dates back to 2001, including his years with Barclay's Global Investors (BGI), which merged with BlackRock in 2009. At BGI, he served as a senior portfolio manager within the European Scientific Equity team. Prior to joining BGI, he worked at the Bank of New York, Europe. Mr. Fisher earned a masters in aeronautical & astronautical engineering from Southampton University in 1999. | |||||||||||||||||||||||||||||
| Fees and Expenses | ||||||||||||
| ||||||||||||
Disclaimer and Important Notes:
- Wealth Management Products are not deposits and have investment risks, and customers should be cautious in making any investment.
- Structured Deposit is different from ordinary deposits and has investment risks, and customers should be aware of the investment risk and cautious in making any investment.
- The relevant information and data displayed in the pages are for reference only and are those of the offshore funds, under Participation Non-Principal Protected Structured Investment Product, invested by QDII product-overseas fund series issued by DBS China, as well as of the onshore funds distributed by DBS China (as the case may be). Unless otherwise specified, all content in the webpages is provided by Morningstar Shenzhen Ltd (“Morningstar”), and it is possible to be modified without any notice. Some information provided by Morningstar to the pages may differ from the original data due to technical or operational reasons. DBS Bank (China) Limited (“DBS China”) has not verified, monitored or endorsed any content on any page and will not give any guarantee or warranty of whatsoever nature in respect of the correctness, completeness, or timeliness of any content on any page.
- Nothing on this page shall constitute an offer or invitation or solicitation to subscribe any product or fund or to enter into any transaction. The content on this page does not have regard to the specific investment objectives, financial situation or particular needs of any specific person and is not intended to provide, and should not be relied upon for accounting, legal or tax advice, or investment recommendations and is not to be taken in substitution for the exercise of judgment by the reader, who should obtain separate legal or financial advice. DBS China does not act as an adviser or assume any fiduciary responsibility or liability for any consequences financial or otherwise.
- Investment involves risks and the risk of loss from investment can be substantial. Opinions and estimates are subject to change without notice. Any past performance, projection, forecast or simulation of results is not necessarily indicative of the future or likely performance of any investment. Before entering into any transaction or making a commitment to purchase any product mentioned on this page, the reader should take steps to ensure that the reader understands the transaction and has made an independent assessment of the appropriateness of the transaction in the light of the reader’s own objectives and circumstances. In particular, the reader should read all relevant documentation pertaining to the product (including but not limited to product offering documents, term sheets, prospectuses or other similar or equivalent offer or issue documents, as the case may be) and may wish to seek advice from a financial or other professional adviser or make such independent investigations as the reader considers necessary or appropriate for such purposes. If the reader chooses not to do so, the reader should consider carefully whether any product mentioned in the webpages is suitable for him. DBS China shall not assume any liability for any loss or damage (whether direct or indirect) of any person arising out of or in connection with any error, omission, delay and/or reliance on any content of any page.