| Morningstar® Fund Report™|07/06/2026 |
|
| Performance History | 31/05/2026 |
| Growth of 1,000(USD) | |
|
|
|
| • | Fund | -11.17 | 5.76 | 2.98 | 4.08 | 0.16 |
| • | +/-Cat | -0.56 | -0.80 | -0.08 | -1.18 | -0.47 |
| • | +/-Idx | 1.33 | -0.98 | -0.18 | -0.60 | -0.76 |
| Category: Global Diversified Bond - USD Hedged | ||||||
| Index: Morningstar Global Core Bond GR Hedged USD | ||||||
| Trailing Returns | 04/06/2026 | |||||
| Fund | +/-Idx | |||||
| YTD | -0.10 | -0.59 | ||||
| 3 Years | 11.01 | -1.81 | ||||
| 5 Years | 1.40 | -0.46 | ||||
| 10 Years | 16.64 | -2.14 | ||||
| 12 Month Yield | - | |||||
| Dividend Paying Frequency | Monthly | |||||
| Key Stats | ||
Morningstar Category
Global Diversified Bond - USD Hedged
Morningstar Rating™

ISIN
HK0000244407
NAV 04/06/2026
USD 7.7500
Day Change
0.00%
Total Net Assets (mil)
29/05/2026
USD 2672.62
USD 2672.62
Front Load Fee(Max)
3.00%
Deferred Load Fee
-
Manager Name
Jason Pang
Arjun Vij
Inception Date
13/05/2015
| Benchmark | ||||
| ||||
| Investment strategy |
| The investment policy of the Fund aims to achieve a return in excess of global bond markets by investing primarily (i.e. at least 80% of its total net asset value) in global investment grade debt securities. Global debt securities include but are not limited to bonds, money market instruments and other debt securities which are issued by the international issuers |
| Portfolio Profile | 30/04/2026 |
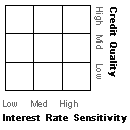
| Morningstar Style Box®_Morningstar: | |||||
| Fixed Income Style | |||||
|
|||||
| Asset Allocation % | |||
| % Long | % Short | % Net Assets | |
| Stocks | 0.00 | 0.00 | 0.00 |
| Bonds | 98.51 | 0.96 | 97.55 |
| Cash | 15.91 | 13.96 | 1.94 |
| Other | 0.50 | 0.00 | 0.50 |
|
|||||||||||||||
|
||||||||||
| Annual Returns | 31/05/2026 | |||||||
| 2019 | 2020 | 2021 | 2022 | 2023 | 2024 | 2025 | 2026 | |
| Total Return | 8.65 | 5.82 | -0.97 | -11.17 | 5.76 | 2.98 | 4.08 | 0.16 |
| +/- Category | 1.13 | 0.54 | 0.47 | -0.56 | -0.80 | -0.08 | -1.18 | -0.47 |
| +/- Index | 0.58 | 0.03 | 0.72 | 1.33 | -0.98 | -0.18 | -0.60 | -0.76 |
| % Rank (Rel to Cat) | 27 | 45 | 29 | 46 | 70 | 56 | 89 | 61 |
| Trailing Returns | 04/06/2026 | |||
| Total Return | +/- Category | +/- Index | ||
| 1 Day | 0.00 | 0.15 | 0.22 | |
| 1 Week | -0.10 | 0.22 | 0.31 | |
| 1 Month | 0.81 | 0.37 | 0.55 | |
| 3 Months | -0.90 | -0.67 | -0.43 | |
| 6 Months | 0.06 | -0.63 | -0.58 | |
| YTD | -0.10 | -0.61 | -0.59 | |
| 1 Year | 2.84 | -0.71 | -0.47 | |
| 3 Years | 11.01 | -3.56 | -1.81 | |
| 5 Years | 1.40 | -3.57 | -0.46 | |
| 10 Years | 16.64 | -5.35 | -2.14 | |
| Category:Global Diversified Bond - USD Hedged | ||||
| Index:Morningstar Global Core Bond GR Hedged USD | ||||
| Quarterly Returns | 31/05/2026 | |||
| Quarter 1 | Quarter 2 | Quarter 3 | Quarter 4 | |
| 2026 | -1.31 | - | - | - |
| 2025 | 0.51 | 1.39 | 1.28 | 0.84 |
| 2024 | 0.08 | -0.33 | 4.20 | -0.93 |
| 2023 | 2.28 | -0.33 | -2.03 | 5.90 |
| Dividend | 04/06/2026 |
| 12 Month Yield | - |
| 2026 | 0.21 |
| 2025 | 0.52 |
| 2024 | 0.50 |
| 2023 | 0.40 |
| Morningstar Rating™ | 31/05/2026 |
| 3-Year |

|
| 5-Year |
|
| 10-Year |
|
| Overall |
|
| Volatility Measurements | 31/05/2026 | |||||||||||||||||||||||||
|
||||||||||||||||||||||||||
| Fixed Income Style | 30/04/2026 | ||||||||||||||||||||||||||||||||
|
|||||||||||||||||||||||||||||||||
|
|||||||||||||||||||||||||||||||||
| Category: Global Diversified Bond - USD Hedged | |||||||||||||||||||||||||||||||||
| AssetAllocation | 30/04/2026 |
|
|
|
|||||||||||||||||||||
| Top 10 Holdings | 30/04/2026 |
| Portfolio | |
| Total Number of Equity Holdings | 0 |
| Total Number of Bond Holdings | 245 |
| Assets in Top 10 Holdings % | 47.12 |
| Product Name | Sector | Country/Region | % of Assets | ||
|
|

|
Germany | 7.61 | ||
|
|
|
Germany | 5.18 | ||
|
|
|
Australia | 3.63 | ||
|
|
|
United States | 3.12 | ||
|
|
|
United Kingdom | 2.37 | ||
|
|
|
Japan | 1.83 | ||
|
|
|
China | 1.79 | ||
|
|
|
United States | 1.76 | ||
|
|
|
Mexico | 1.71 | ||
|
|
|
Colombia | 1.71 | ||
|
|
|||||
| Category: Global Diversified Bond - USD Hedged | |||||
| For the market value of financial derivatives, Morningstar's calculation method includes the nominal value of derivative agreements to reflect position-holding (position) for your reference. If the position-holding ranking calculated by Morningstar shall be different from that published by the fund company, the ranking in the monthly report (click here) by the fund company shall prevail. | |||||
| Management Team | |||||||||||||||||||||||||||||
|
|||||||||||||||||||||||||||||
|
|||||||||||||||||||||||||||||
| Biography | |||||||||||||||||||||||||||||
| Jason Pang, executive director, is a member of the Global Fixed Income, Currency & Commodities (GFICC) group. Based in Hong Kong, Jason is a portfolio manager for the Asian Fixed Income team and is responsible for local rates and FX. Prior to joining the firm in 2016, he was a portfolio manager with similar focus at AXA IM and HSBC Global Asset Management. From 2006 to 2013, Jason worked for UBS in Hong Kong and occupied a number of roles within the wholesale distribution team before becoming a portfolio manager in 2010. Jason holds a B.S. double major in actuarial science and economics from the University of Toronto and is a holder of the CAIA and FRM designations. | |||||||||||||||||||||||||||||
|
|||||||||||||||||||||||||||||
| Biography | |||||||||||||||||||||||||||||
| Arjun Vij, CFA, vice president, is a member of the Global Fixed Income, Currency & Commodities (GFICC) group. Based in Hong Kong, he is a portfolio manager on the Global Aggregate Strategies team and manages the J.P. Morgan Bond Fund. He is also responsible for managing multi-sector bond portfolios for Asian institutional clients, and customized credit portfolios for private clients. Previously, while based in London, he structured liability-aware portfolios for European insurance companies, and while based in Columbus, Ohio, he assisted in managing customized credit portfolios for US-based pension plans. Arjun obtained a B.A. in economics from the University of Chicago, is a CFA charterholder and holds the Investment Management Certificate from the UK society of Investment Professionals. | |||||||||||||||||||||||||||||
| Fees and Expenses | ||||||||||||
| ||||||||||||
Disclaimer and Important Notes:
- Wealth Management Products are not deposits and have investment risks, and customers should be cautious in making any investment.
- Structured Deposit is different from ordinary deposits and has investment risks, and customers should be aware of the investment risk and cautious in making any investment.
- The relevant information and data displayed in the pages are for reference only and are those of the offshore funds, under Participation Non-Principal Protected Structured Investment Product, invested by QDII product-overseas fund series issued by DBS China, as well as of the onshore funds distributed by DBS China (as the case may be). Unless otherwise specified, all content in the webpages is provided by Morningstar Shenzhen Ltd (“Morningstar”), and it is possible to be modified without any notice. Some information provided by Morningstar to the pages may differ from the original data due to technical or operational reasons. DBS Bank (China) Limited (“DBS China”) has not verified, monitored or endorsed any content on any page and will not give any guarantee or warranty of whatsoever nature in respect of the correctness, completeness, or timeliness of any content on any page.
- Nothing on this page shall constitute an offer or invitation or solicitation to subscribe any product or fund or to enter into any transaction. The content on this page does not have regard to the specific investment objectives, financial situation or particular needs of any specific person and is not intended to provide, and should not be relied upon for accounting, legal or tax advice, or investment recommendations and is not to be taken in substitution for the exercise of judgment by the reader, who should obtain separate legal or financial advice. DBS China does not act as an adviser or assume any fiduciary responsibility or liability for any consequences financial or otherwise.
- Investment involves risks and the risk of loss from investment can be substantial. Opinions and estimates are subject to change without notice. Any past performance, projection, forecast or simulation of results is not necessarily indicative of the future or likely performance of any investment. Before entering into any transaction or making a commitment to purchase any product mentioned on this page, the reader should take steps to ensure that the reader understands the transaction and has made an independent assessment of the appropriateness of the transaction in the light of the reader’s own objectives and circumstances. In particular, the reader should read all relevant documentation pertaining to the product (including but not limited to product offering documents, term sheets, prospectuses or other similar or equivalent offer or issue documents, as the case may be) and may wish to seek advice from a financial or other professional adviser or make such independent investigations as the reader considers necessary or appropriate for such purposes. If the reader chooses not to do so, the reader should consider carefully whether any product mentioned in the webpages is suitable for him. DBS China shall not assume any liability for any loss or damage (whether direct or indirect) of any person arising out of or in connection with any error, omission, delay and/or reliance on any content of any page.